In this research update, we uncover how Evo 2, a DNA foundation model, represents the tree of life—the phylogenetic relationships between species. We find that phylogeny is encoded geometrically in the distances along a curved manifold, one of the most complex manifold examples yet found (to our knowledge) in a foundation model.
Our results support an emerging picture of feature manifolds—that they tend to have a dominant flat representation (with respect to the ambient space) plus higher curvature deviations—and point to both better ways of understanding scientific AI models and better interpretability techniques.
Contents
Background: Why do interpretability on scientific models?
Scientific AI models trained to model natural systems are revolutionizing research across scientific domains, including protein interaction prediction [1]Accurate structure prediction of biomolecular interactions with AlphaFold 3
Abramson, J., Adler, J., Dunger, J. et al. Nature 630, 493–500 (2024). [DOI], protein design [2]De novo design of protein structure and function with RFdiffusion
Watson, J.L., Juergens, D., Bennett, N.R. et al. Nature 620, 1089–1100 (2023). [DOI], disease prediction [3]A catalogue of genetic mutations to help pinpoint the cause of diseases
Žiga Avsec and Jun Cheng, 2023. Google DeepMind Blog. [link], and materials discovery [4]Millions of new materials discovered with deep learning
Amil Merchant and Ekin Doğuş Çubuk, 2023. Google DeepMind Blog. [link]. These models have several qualities which make interpretability - the science of understanding their internal representations and mechanisms - both challenging and valuable:
- Many of these models exhibit performance beyond bioinformatics baselines, suggesting that they have learned scientifically novel algorithms and principles. Interpretability could enable us to elicit these scientific insights. Better interpretability may allow the models' internal representations to be used for downstream tasks (like protein structure prediction).
- Scientific AI models may learn true biological mechanisms alongside heuristics and memorized solutions. For example, protein language models predict amino acid interactions based on a set of memorized local motifs, not a full understanding of the folded protein [5]Protein language models learn evolutionary statistics of interacting sequence motifs
Z. Zhang, H.K. Wayment-Steele, G. Brixi, H. Wang, D. Kern, & S. Ovchinnikov, Proc. Natl. Acad. Sci. U.S.A. 121 (45) e2406285121, (2024). [DOI]. Interpretability can help us determine the reasons for a model's predictions and therefore improve their reliability and transparency for downstream applications (especially in clinical domains). - Unlike language or vision models, their inputs and outputs aren't human-readable - you can't glance at a DNA sequence and intuit what it means the way you can with text or images, making them harder to “prompt” in their natural input space. Interpretability-based techniques could instead give us human-interpretable controls to edit and steer these models at inference time.
At Goodfire, we're building interpretability tools aimed at all of the above. As part of that work, we're pursuing fundamental research into how scientific models represent complex concepts - in this case, the tree of life in a genomics model.
In this research update, we examine Evo 2 [6]Genome modeling and design across all domains of life with Evo 2
Garyk Brixi, Matthew G. Durrant, Jerome Ku, Michael Poli, Greg Brockman, Daniel Chang, Gabriel A. Gonzalez, Samuel H. King, David B. Li, Aditi T. Merchant, Mohsen Naghipourfar, Eric Nguyen, Chiara Ricci-Tam, David W. Romero, Gwanggyu Sun, Ali Taghibakshi, Anton Vorontsov, Brandon Yang, Myra Deng, Liv Gorton, Nam Nguyen, Nicholas K. Wang, Etowah Adams, Stephen A. Baccus, Steven Dillmann, Stefano Ermon, Daniel Guo, Rajesh Ilango, Ken Janik, Amy X. Lu, Reshma Mehta, Mohammad R.K. Mofrad, Madelena Y. Ng, Jaspreet Pannu, Christopher Ré, Jonathan C. Schmok, John St. John, Jeremy Sullivan, Kevin Zhu, Greg Zynda, Daniel Balsam, Patrick Collison, Anthony B. Costa, Tina Hernandez-Boussard, Eric Ho, Ming-Yu Liu, Thomas McGrath, Kimberly Powell, Dave P. Burke, Hani Goodarzi, Patrick D. Hsu, and Brian L. Hie. bioRxiv 2025.02.18.638918. [DOI], a large open-source DNA foundation model trained by Arc Institute. Evo 2 has an autoregressive transformer-like architecture, and its inputs and outputs are DNA nucleotide sequences. The model is the largest genomics model to date and has a notably diverse training dataset that covers all domains of life.
Understanding model ontologies: how does Evo 2 represent the tree of life?
The evolutionary relationships between species, known as phylogeny, are particularly interesting targets for interpretability because their hierarchical tree-like structures are ubiquitous in biology and many scientific domains. We even expect language models to inherit this structure, for example in the hierarchical relationships between animal words, like “mammal” to “dog” or “bird” to “hawk” [7]The Geometry of Categorical and Hierarchical Concepts in Large Language Models
Kiho Park, Yo Joong Choe, Yibo Jiang, Victor Veitch, 2024. arXiv. [link].
Evo 2 is trained over long DNA sequences, so it can potentially infer the species from one part of a sequence and use this knowledge to improve predictions in other parts. This post addresses the questions: Can Evo 2 infer the species for a given DNA sequence? Does Evo 2 understand how two related species are related? What does this tell us about representations more broadly?
Unlike language modeling, scientific domains can often provide (approximately) ground truth data to help extract these types of representations.
For the tree of life, we obtain the phylogenetic trees for 2400+ bacterial species from the Genome Taxonomy Database (GTDB) [8]GTDB: an ongoing census of bacterial and archaeal diversity
Parks, D.H., et al. (2021). "GTDB: an ongoing census of bacterial and archaeal diversity through a phylogenetically consistent, rank normalized and complete genome-based taxonomy." Nucleic Acids Research. [DOI]
Additional GTDB references: Rinke, C, et al. (2021). Nature Microbiology 6, 946–959; Parks, D.H., et al. (2020). Nature Biotechnology; Parks, D.H., et al. (2018). Nature Biotechnology, 36: 996-1004.. The phylogenetic distance between two species is calculated from the total branch-length connecting them, which is proportional to the number of mutational differences in 120 bacterial marker genes used by GTDB.
Dataset construction: disentangling phylogenetics from sequence similarity
The traditional method to infer a phylogeny from genomes is to compare very similar sequences, typically regions of highly conserved genes, and do hierarchical clustering. Genomic models have been used to supplement this approach by clustering on the model embeddings instead of the sequences directly [9]Alignment-free Bacterial Taxonomy Classification with Genomic Language Models
Mike Leske, Jamie A. FitzGerald, Keith Coughlan, Francesca Bottacini, Haithem Afli, and Bruno Gabriel Nascimento Andrade. bioRxiv 2025.06.27.662019. [DOI].
But we're interested mainly in the model's internal representations. If the input sequences are very similar, then the activations will also be similar, regardless of the model's representations. We need to remove this sequence similarity confounder from our analysis. To do so, we sample regions independently for each species.
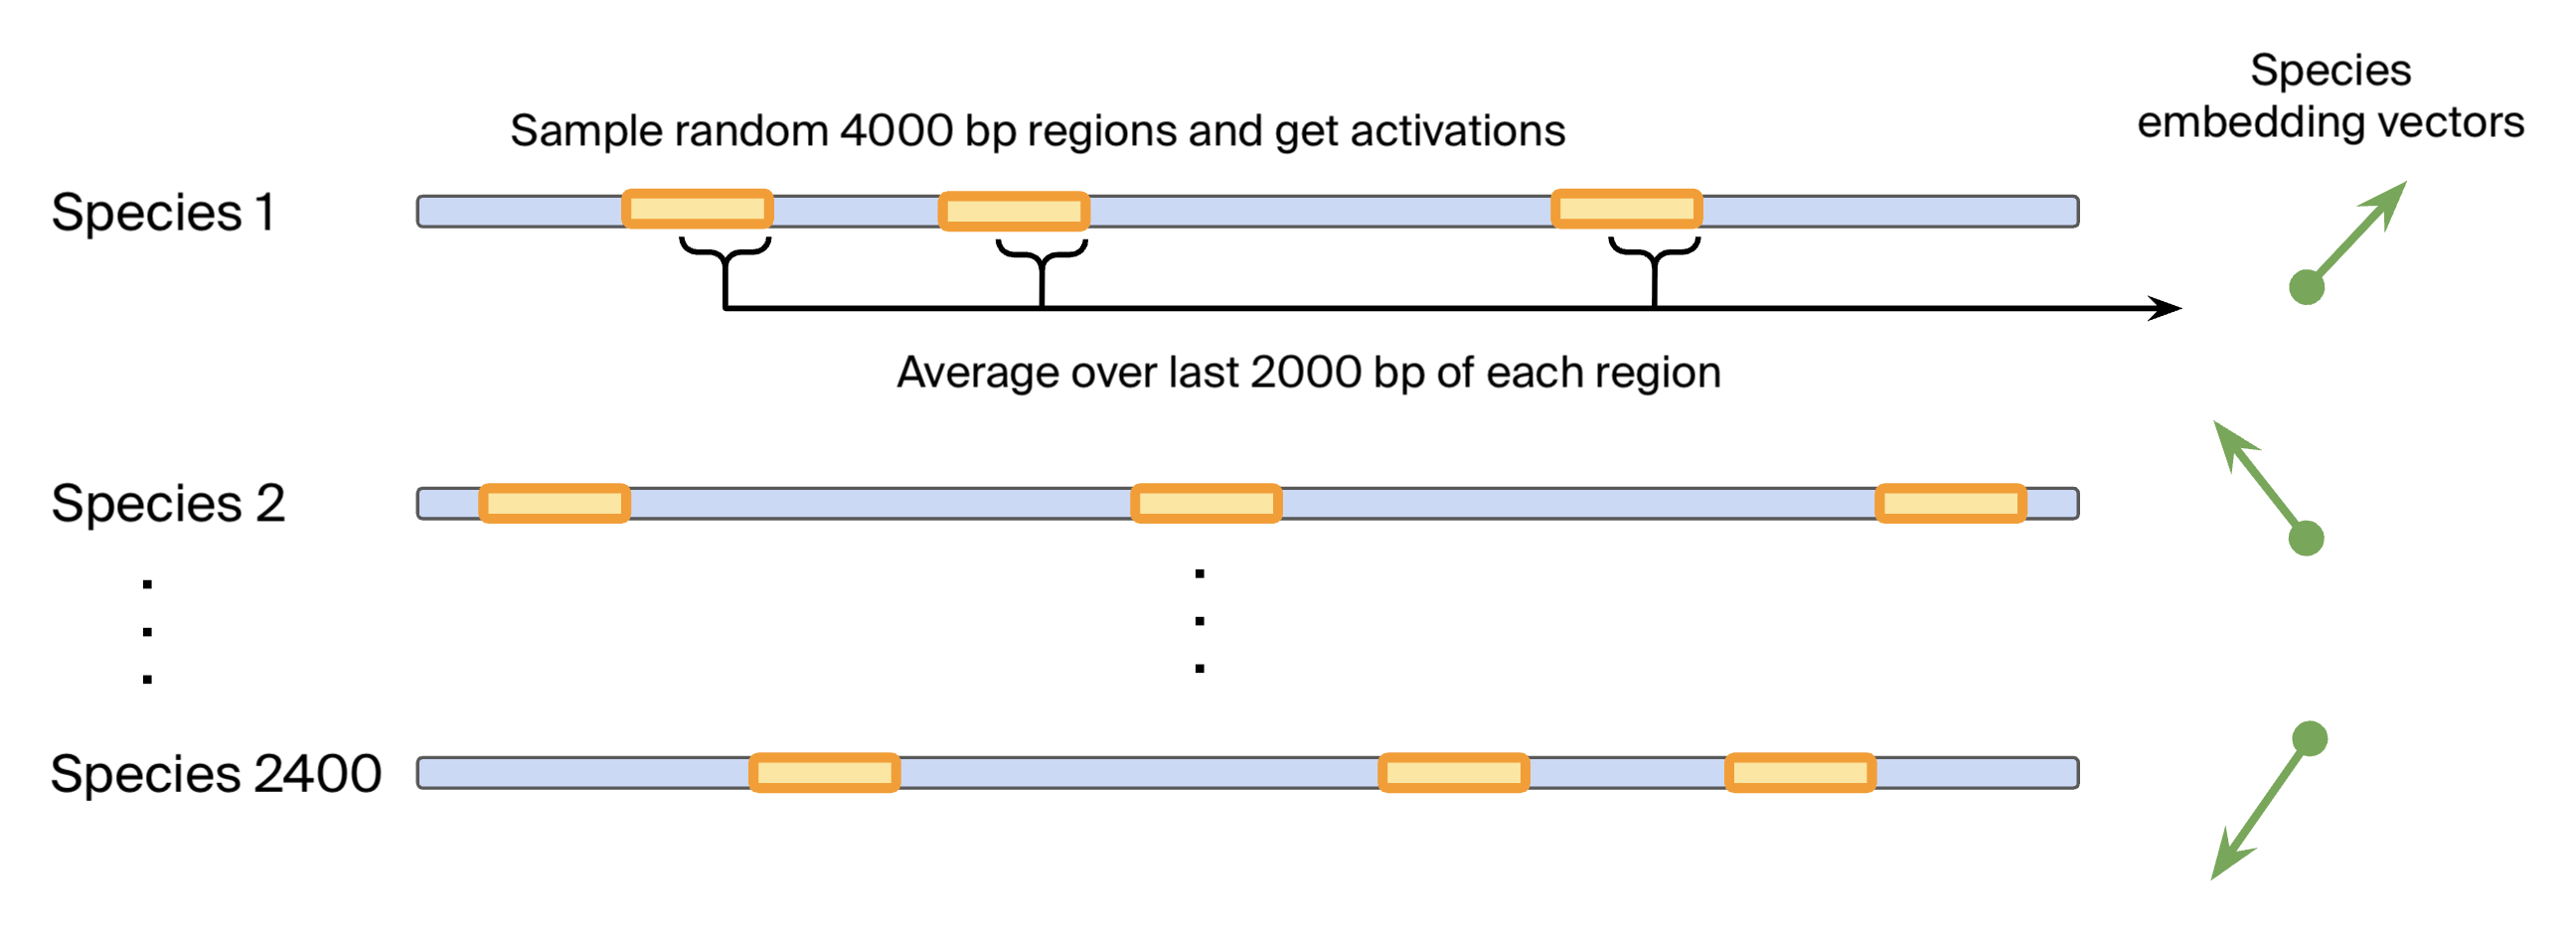
Specifically, we construct a dataset of 2400+ species-averaged embeddings as follows:
- Sample 4000 bp genomic regions randomly per species, covering around 5% of the genome.
- Get Evo 2 internal activations over the genomic region from layer 24 (of 32). This layer had the highest performance for probes predicting phylogenetic taxa.
- Average the activations for each species using only the last 2000 bp of each genomic region to obtain species embeddings. This ensures that the model has enough context over which to develop any representations.
This dataset should reflect the species-level or genome-level representations that do not cancel out when averaging over random sequences.
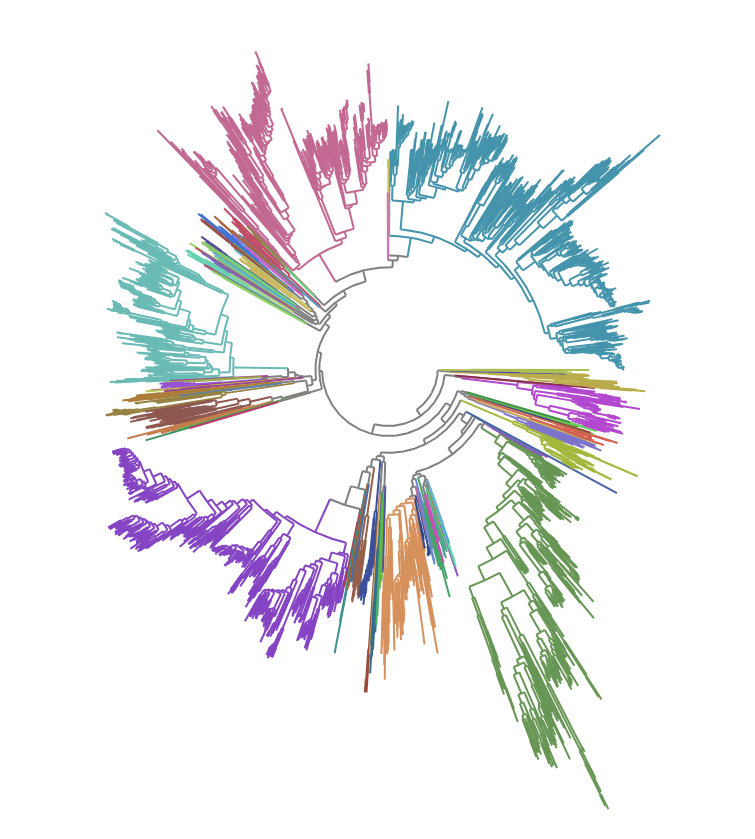
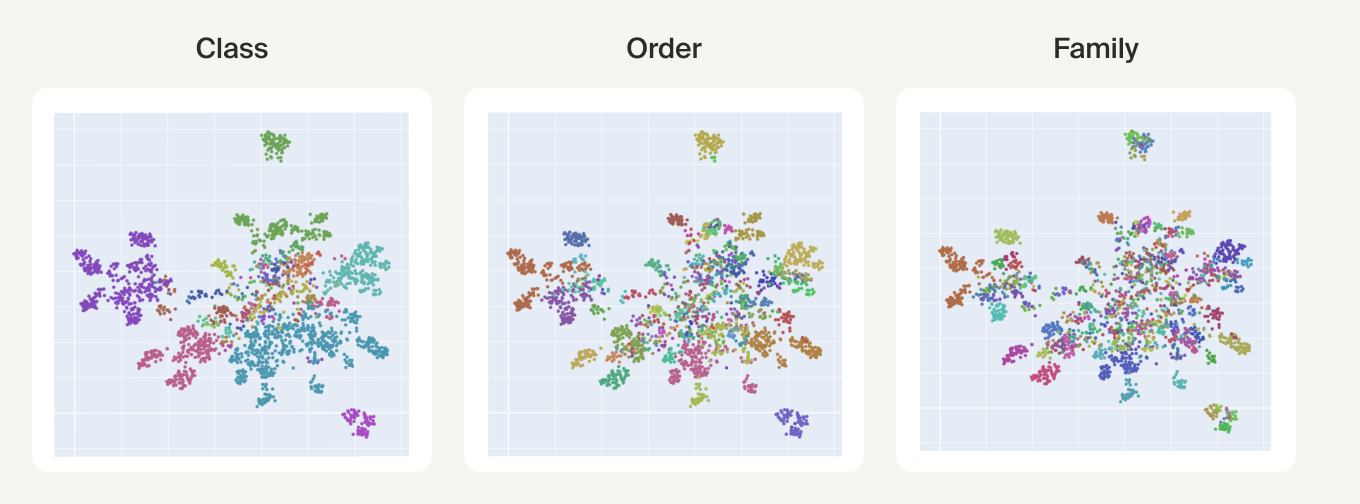
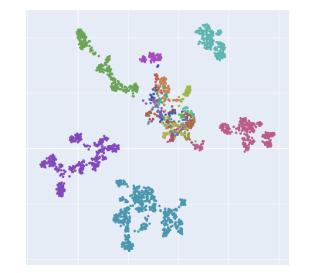
UMAPs of this dataset show tree-like structures and appear to cluster per class (color) along with finer-grained clustering at the order and family level, at least for well-represented groups. This corroborates our expectations for the structure of the dataset: taxonomy seems to explain a substantial amount of the total variance in the data.
More recently, fine-tuned genomic models, such as DNABERT-S [10]DNABERT-S: Pioneering Species Differentiation with Species-Aware DNA Embeddings
Zhihan Zhou, Weimin Wu, Harrison Ho, Jiayi Wang, Lizhen Shi, Ramana V Davuluri, Zhong Wang, and Han Liu, 2024. arXiv. [link] and PhyloTune [11]PhyloTune: An efficient method to accelerate phylogenetic updates using a pretrained DNA language model
Deng, D., Xu, W., Wu, B. et al. Nat Commun 16, 6905 (2025). [DOI], have been trained specifically for downstream clustering and taxonomic classification. For such models, the species-averaged embeddings would likely show even stronger clustering.
Experiments
Finding a phylogenetic manifold
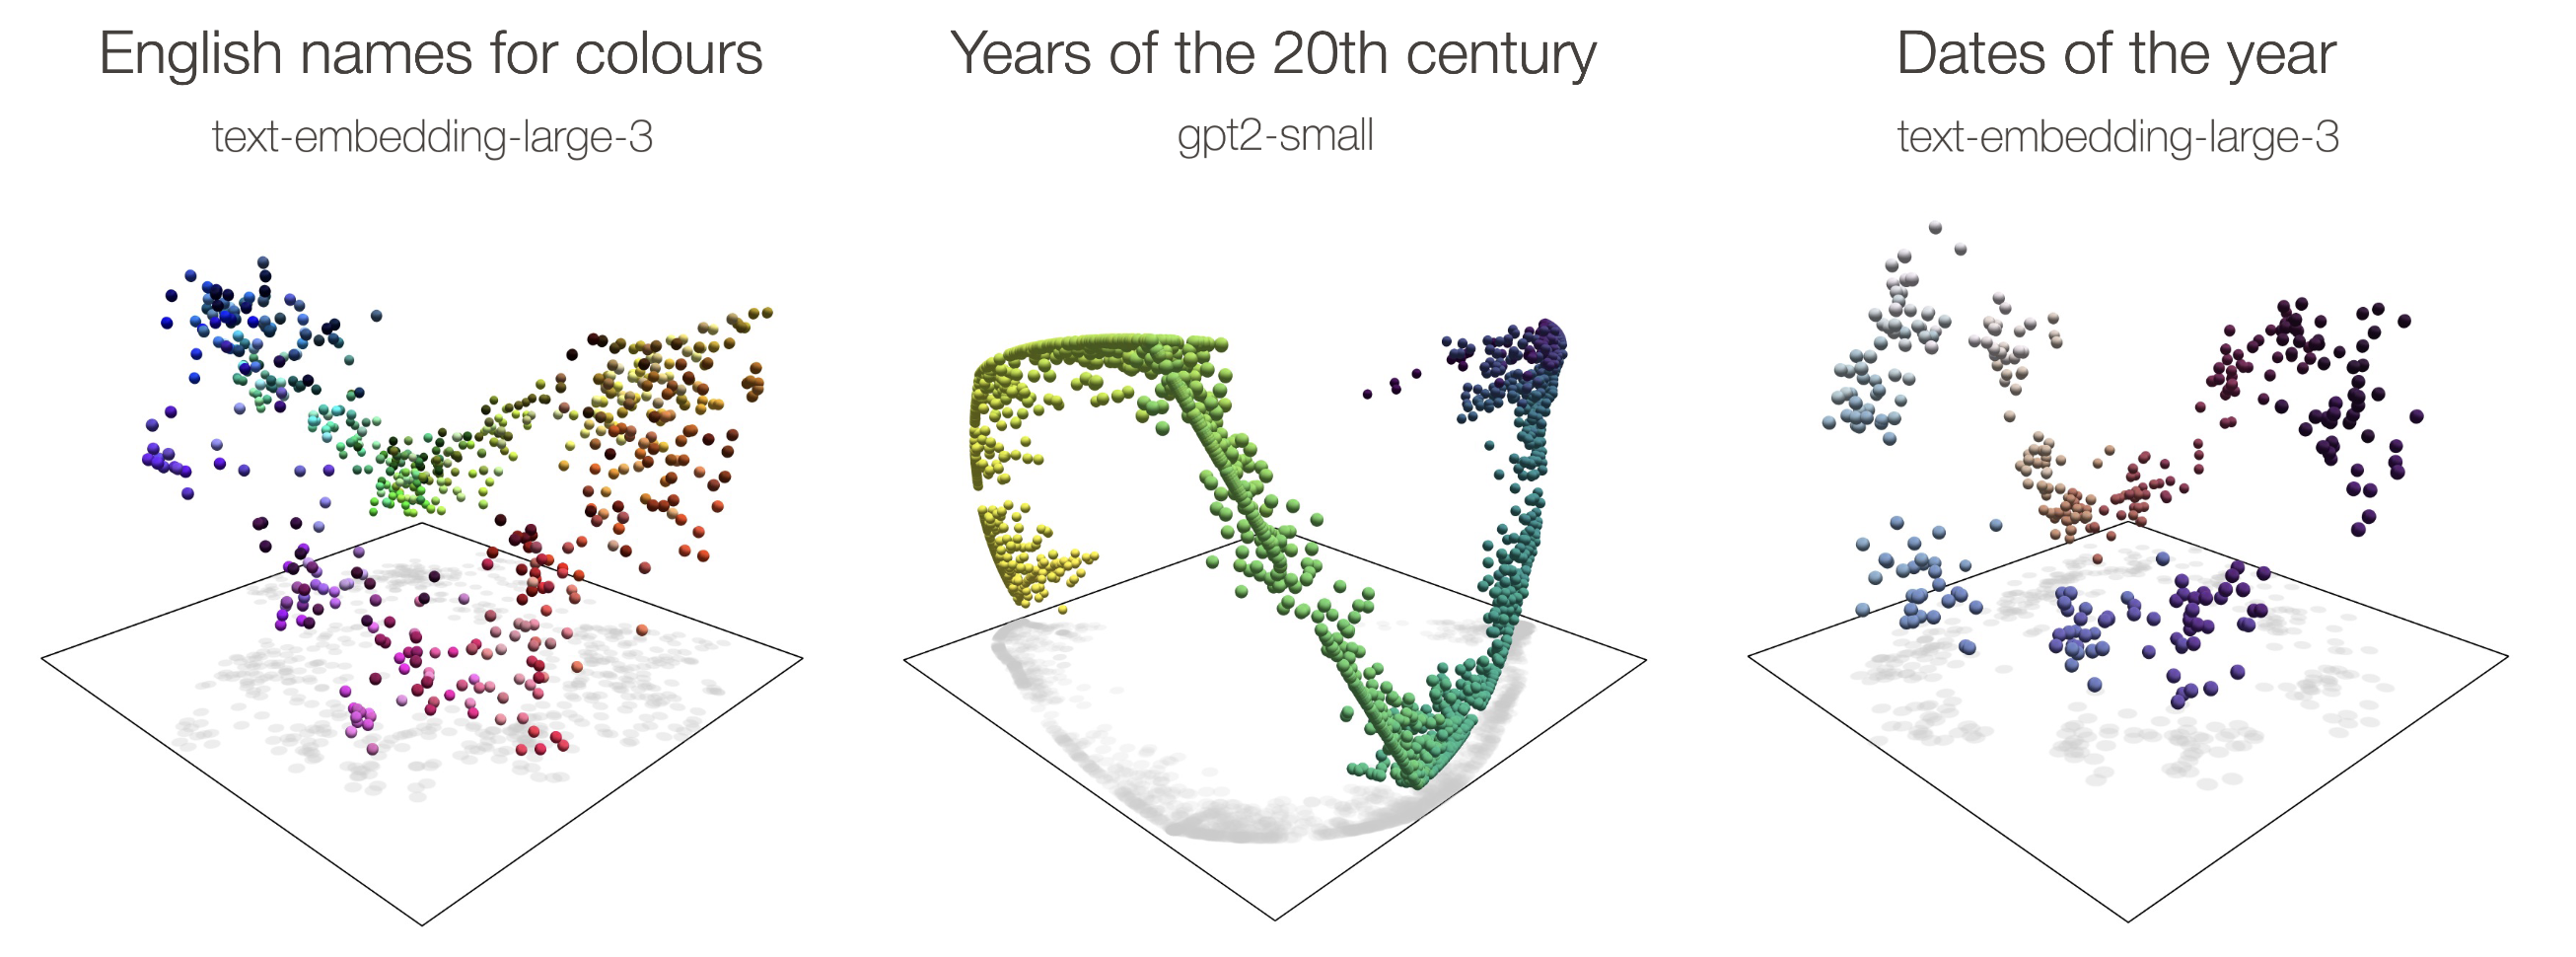
Recent interpretability work has identified several examples of feature manifolds in LLMs where distances along the manifold are interpretable. These include circular manifolds for calendar features (days of the week, months of the year, dates) [12]Not all features are one‑dimensionally linear
Joshua Engels, Eric J. Michaud, Isaac Liao, Wes Gurnee, and Max Tegmark, 2024. arXiv. [link] and colors [13]The Origins of Representation Manifolds in Large Language Models
Alexander Modell, Patrick Rubin-Delanchy, Nick Whiteley, 2025. arXiv. [link], and helical manifolds for numbers [14]Language Models Use Trigonometry to Do Addition
Subhash Kantamneni and Max Tegmark, 2025. arXiv. [link] and years [12]Not all features are one‑dimensionally linear
Joshua Engels, Eric J. Michaud, Isaac Liao, Wes Gurnee, and Max Tegmark, 2024. arXiv. [link]. Feature manifolds are one manifestation of feature geometry, where meaning is encoded in the geometric relationships between features in feature space. Current mechanistic interpretability methods generally ignore feature geometry, so finding more feature manifolds points us toward new interpretability techniques.
In all of these examples, the manifolds bend into extra dimensions - for example the “ripples” appearing in the circular manifolds [15]Curve detector manifolds in InceptionV1
Liv Gorton, 2024. Personal blog. [link]. One hypothesis is that the extra curvature is just predictable “jitter” that allows models to better distinguish nearly-parallel directions along the manifold [16]What is a Linear Representation? What is a Multidimensional Feature? (in Circuits Updates - July 2024)
Chris Olah and Adam Jermyn, 2024. Transformer Circuits Thread. [link] [17]Feature Manifold Toy Model (in Circuits Updates – May 2023)
Chris Olah and Josh Batson, 2023. Transformer Circuits. [link]. However, it's also plausible that the curvature represents additional semantic information.
In either case, the distances along the curved manifold may be meaningful. Indeed, recent work by Modell et al (2025) [18]The Origins of Representation Manifolds in Large Language Models
Alexander Modell, Patrick Rubin-Delanchy, and Nick Whiteley, 2025. arXiv. [link] find that distances along shortest paths (geodesics) are linearly correlated with sensible distance metrics.
We followed the same approach as Modell et al (2025) to analyze the species-averaged embeddings:
- We compared cosine similarity to the phylogenetic distance, finding that the relationship is mostly monotonic.
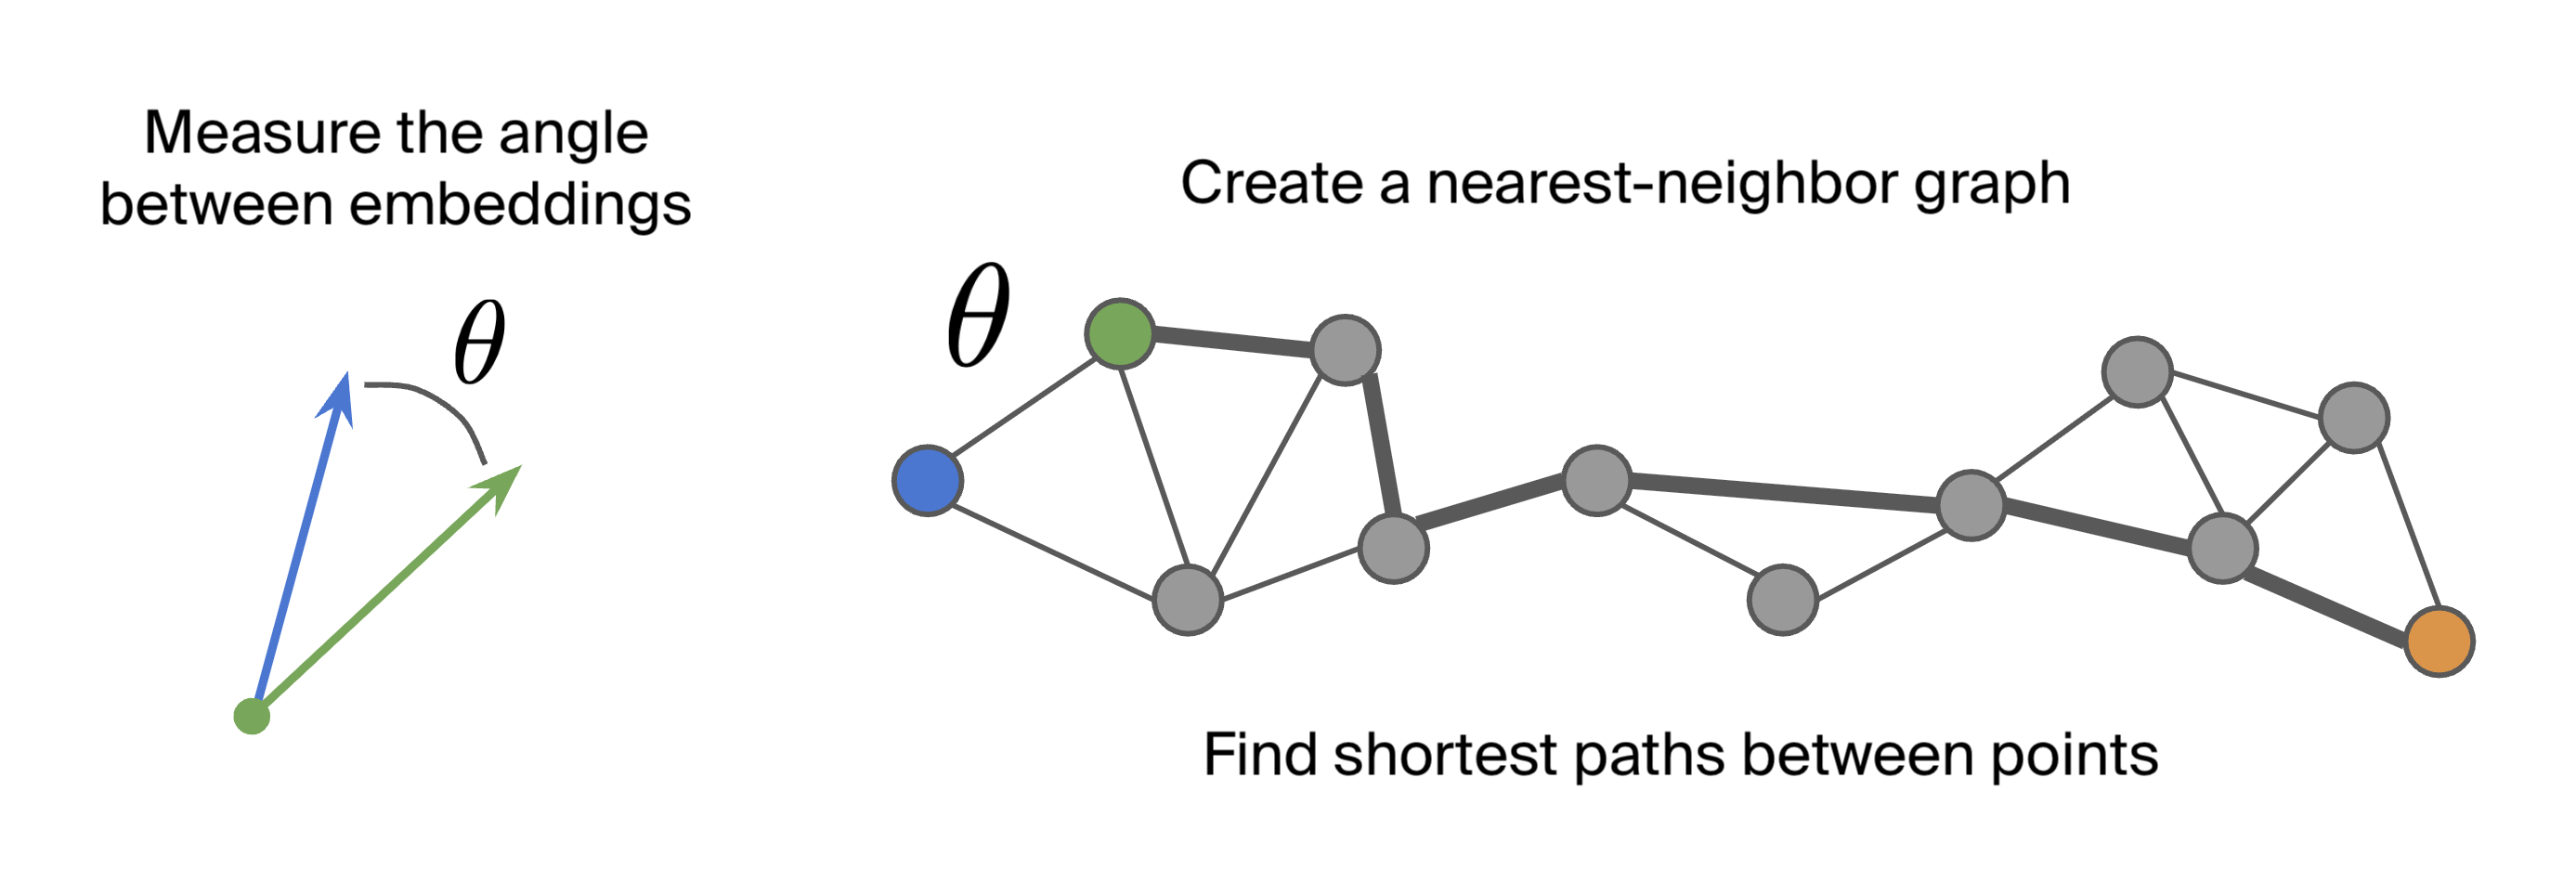
- We computed a K-nearest neighbor graph using the smallest K that resulted in a connected graph (K=27). For the distance metric we used angular distance (i.e., the arccosine of the cosine similarity).
- The geodesic distance (the shortest-path distance along the manifold) was computed by finding the shortest path connecting two species along the graph and adding up the angular distances.
Like the LLM manifolds, we find that the geodesic distances are correlated with phylogenetic distances!
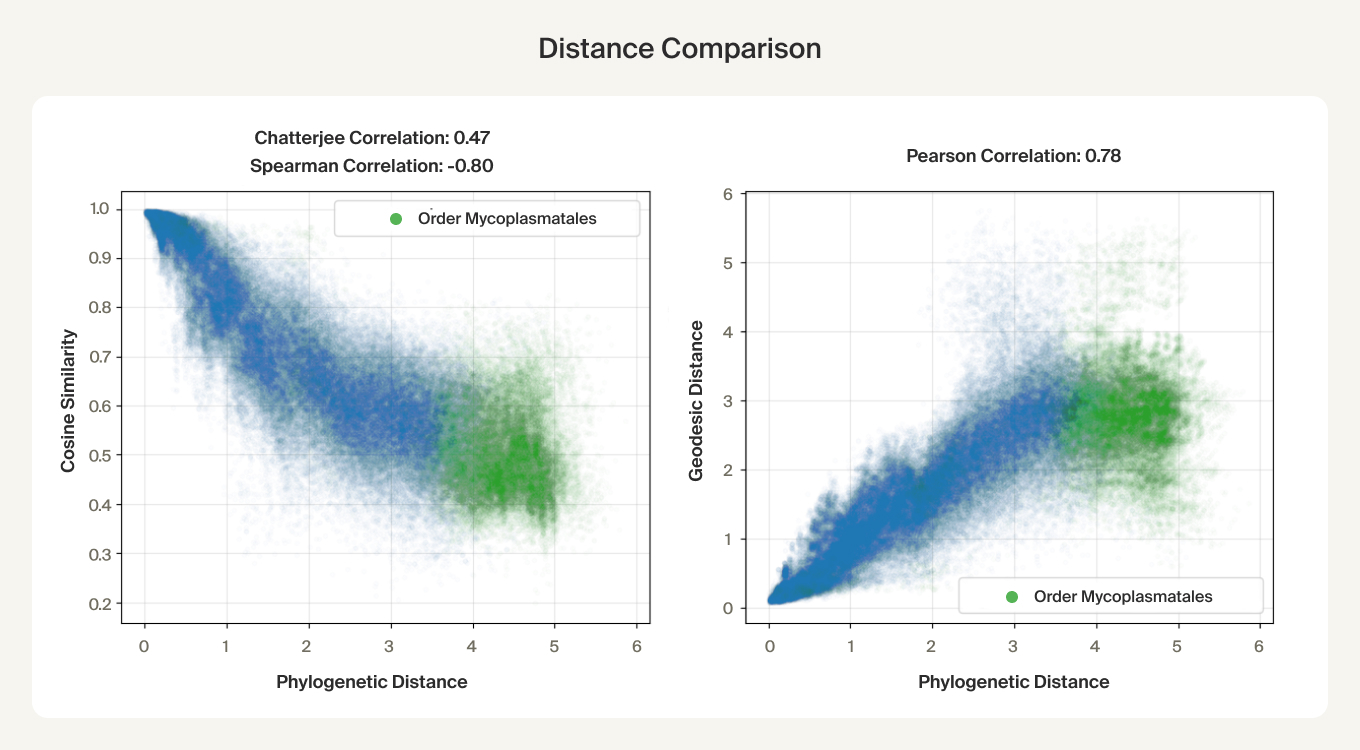
The linear trend continues out to all but the largest phylogenetic distances, which are almost exclusively between species pairs that include the order Mycoplasmatales (the outlier green cluster in the class-colored UMAPs above). This bacterial order has several rare properties - no cell walls, sterol-requirement for growth, ambiguous stop codons, highly reduced genomes - and may represent an out-group not well captured in the nearest neighbor graph.
Phylogenetics is much more complex than dates of the year or the number line, so finding a similar pattern hints at a general underlying mechanism. Closely-related species should have similar predictions and therefore similar embeddings, and likewise distantly-related species should have dissimilar embeddings. Perhaps this push and pull on embeddings during training organizes the geometry of the embeddings to reflect the data's underlying distances!
Overall, the existence of a feature manifold for something as complex as a phylogeny provides further evidence that feature geometry is important.
Finding a flat representation
Consider for a moment an analogous interpretability study in which we extract LLM embeddings for different cities. Within the embeddings, we can find a subspace that describes the latitudes and longitudes of the cities and plot them on a map [19]Language Models Represent Space and Time
Wes Gurnee and Max Tegmark, 2023. arXiv. [link]. All the extra information about the cities, like their language and culture, would be captured by extra directions or curvature on top of the latitude-longitude representations.
We see this pattern of having a flat representation underlying the curved manifold in the other manifold examples found in LLMs—for example, the simple circle underlying the wavy manifold for dates of the year above. Within the flat representation, distances directly correspond to the expected ones, without needing to consider short paths along the manifold. Can we find a similar flat representation for phylogenies? Can we find a “coordinate system” for species?
To find a flat representation, we can learn a transformation to a subspace where cosine similarities are directly correlated with phylogenetic distances. This ends up being equivalent to learning a distance metric on the original space, similar to other metric learning approaches [20]Metric Learning on Manifolds
Max Aalto and Nakul Verma, 2019. arXiv. [link] [21]A Structural Probe for Finding Syntax in Word Representations
John Hewitt, Christopher D. Manning, 2019. NAACL. [link]. The setup resembles an autoencoder but the loss includes a term for the error in the predicted distance:
where $\alpha$ (reconstruction parameter) is a fixed hyperparameter and $\beta$ (the distance rescaling) is learnable.
The loss also includes a reconstruction term for the inputs. Without this, it's not possible to estimate what variance explained by the subspace, since the encoder $W_\text{enc}$ is a down-projection with no unique inverse. To minimize parameters, we simply use the pseudoinverse in place of a learned decoder. A relatively small reconstruction parameter is sufficient and we find the results are relatively insensitive to its value.
We perform cross-validation via clade holdouts: for each run we hold out 20% of species-averaged embeddings by omitting approximately 20 clades (from any taxonomic level), each comprising about 1% of the total number of species.
We find that phylogenetic distances are well-captured (correlation 0.98) by a learned subspace with 10 dimensions, roughly at the elbow of the performance curves. This subspace captures ~70% of the variance, so this flat representation seems to make up a sizable portion of the embeddings. UMAPs for the learned subspaces, using the same parameters as above, show qualitatively finer-grained structures compared to the untransformed embeddings.
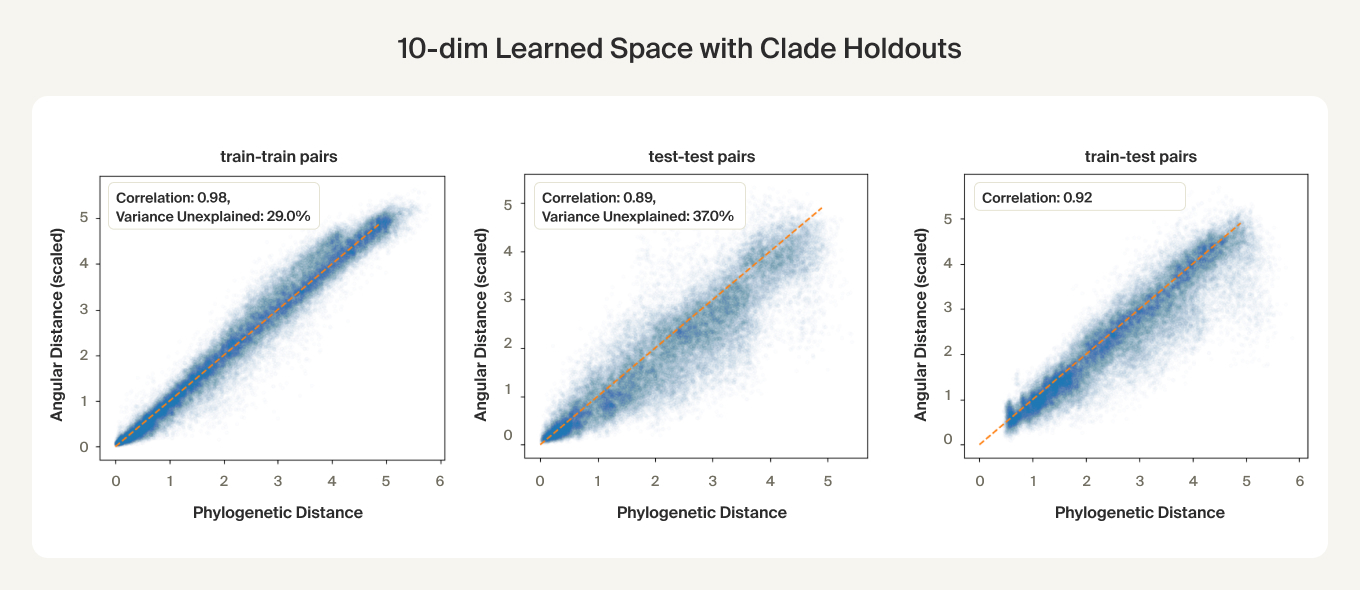
For the clade holdouts, the predicted distances have about 0.9 correlation, suggesting a degree of generalization. Given the higher train set correlations (0.98), there may be some overfitting, but we found that weight decay was ineffective and led to worse test set performance and that performance on a non-clade test set was on par with the train set. One hypothesis is that each clade has an extra direction unique to it that the subspace doesn't learn to project out when the clade is held out.
What do these results mean? Finding a flat representation for phylogenies that explains a sizable portion of the variance is additional evidence supporting the “flat structure + ripples” picture of feature manifolds.
Species as genomic “styles”
We've examined the structure of the species-averaged embeddings, but what signals are they actually capturing?
The embeddings are obtained from random genomic regions, so the model might pick up two types of signals in context:
- The general “style” of DNA, such as using certain codons more or less. This would be similar to how language models can pick up on an author's writing style by their word usage [22]What's in a prompt? Language models encode literary style in prompt embeddings
Raphaël Sarfati, Haley Moller, Toni J. B. Liu, Nicolas Boullé, and Christopher Earls, 2025. arXiv. [link]. - Specific memorized subsequences of DNA that uniquely identify the species or other taxonomic group. This would be similar to how modern alignment-free taxonomic tools, such as Kraken [23]Improved metagenomic analysis with Kraken 2
Wood, D.E., Lu, J. & Langmead, B. Genome Biol 20, 257 (2019). [DOI] and sourmash [24]Large-scale sequence comparisons with sourmash
Pierce NT, Irber L, Reiter T, Brooks P, Brown CT. F1000Res. 2019 Jul 4;8:1006. [DOI]. PMID: 31508216; PMCID: PMC6720031., learn unique k-mers for each taxon and use these for identification.
Although longer subsequences are more uniquely identifying, there are many salient nucleotide statistics the model can pick up on. For example, GC content (the number of G and C nucleotides) [25]Genomic Legacies of Ancient Adaptation Illuminate GC-Content Evolution in Bacteria
Teng W, Liao B, Chen M, Shu W. Microbiol Spectr. 2023 Feb 14;11(1):e0214522. [DOI]. Epub 2022 Dec 13. PMID: 36511682; PMCID: PMC9927291., amino acid codon patterns [26]Codon use and aversion is largely phylogenetically conserved across the tree of life
Miller JB, McKinnon LM, Whiting MF, Ridge PG. Mol Phylogenet Evol. 2020 Mar;144:106697. [DOI]. Epub 2019 Dec 2. PMID: 31805345. [27]Elucidation of Codon Usage Signatures across the Domains of Life
Novoa EM, Jungreis I, Jaillon O, Kellis M. Mol Biol Evol. 2019 Oct 1;36(10):2328-2339. [DOI]. PMID: 31220870; PMCID: PMC6759073., and the statistics of tetranucleotides are all phylogenetically conserved [28]Evolutionary implications of microbial genome tetranucleotide frequency biases
Pride DT, Meinersmann RJ, Wassenaar TM, Blaser MJ. Genome Res. 2003 Feb;13(2):145-58. [DOI]. PMID: 12566393; PMCID: PMC420360.. These patterns reflect adaptations to environmental and mutational pressures (they're not just statistical artifacts of evolution). For example, codon usage is tied to transcription rates, which are optimized in fast growing species, while GC content may be due to biases induced by a cell's DNA repair machinery [29]Synonymous but not the same: the causes and consequences of codon bias
Plotkin JB, Kudla G. Nat Rev Genet. 2011 Jan;12(1):32-42. [DOI]. Epub 2010 Nov 23. PMID: 21102527; PMCID: PMC3074964..
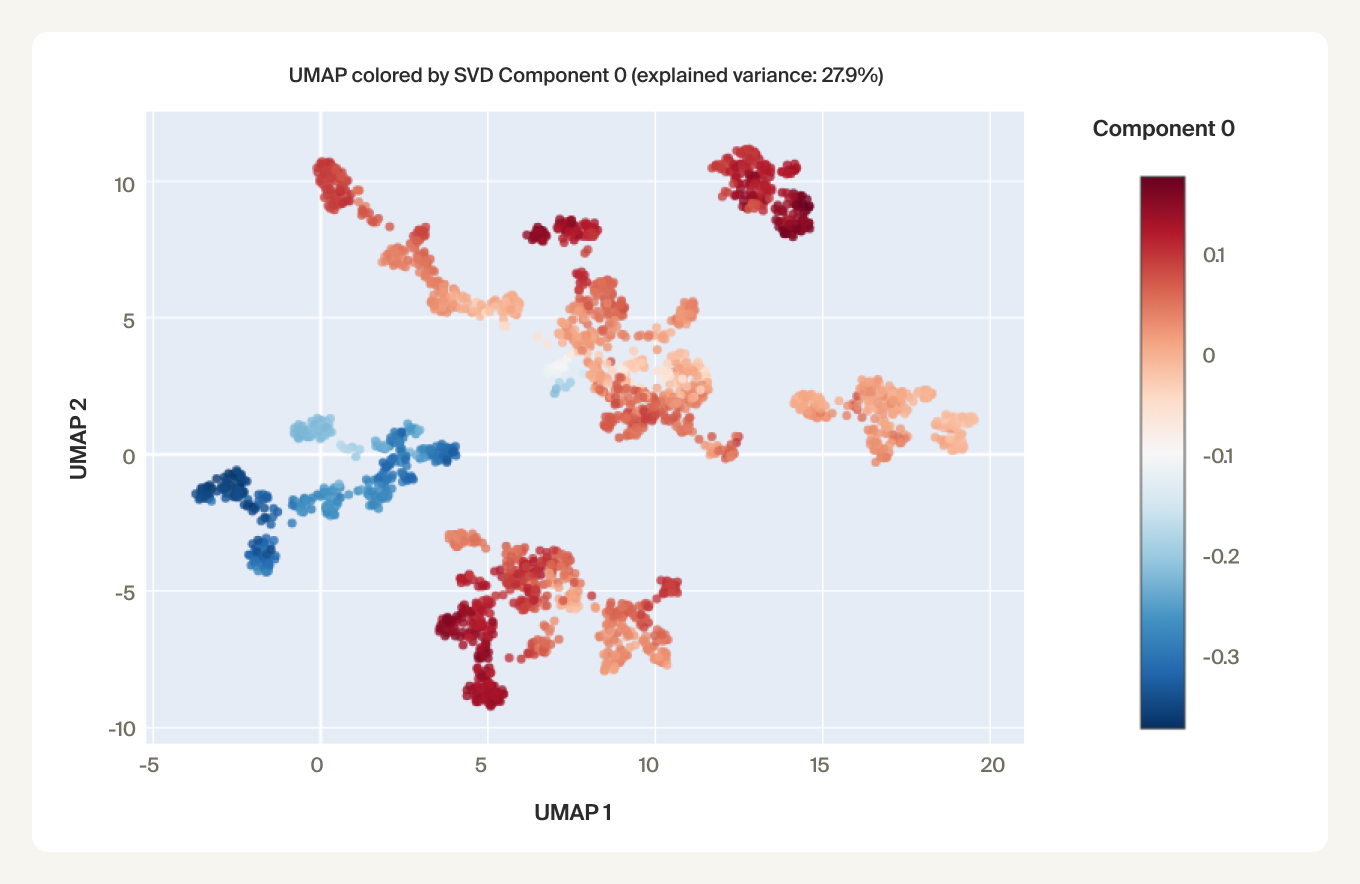
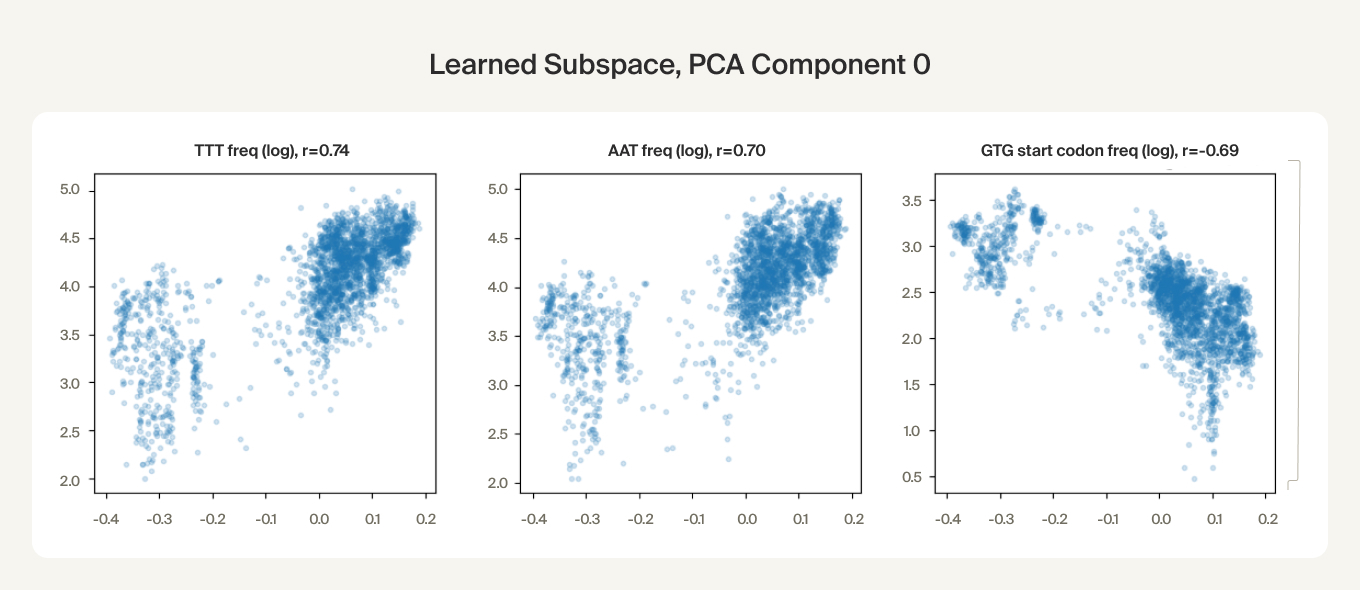
We find preliminary evidence that the embeddings capture these nucleotide statistics. The first PCA component of the learned subspace is correlated with the certain codon frequencies. We also found that the learned subspace activations can be predicted with high correlation (~0.9) from genome-wide statistics of combinations up to 4 nucleotides using an XGBoost model.
In language models, in-context learning can allow models to adapt their predictions to generalize to potentially new contexts. Here, we find that DNA models may use a type of in-context learning to infer the species for a given DNA sequence, helping orient their predictions within the space of species. We believe that in-context learning may be an important perspective for understanding DNA sequence models, especially autoregressive ones like Evo 2.
Discussion
In this research update, we show how ground-truth phylogenies can be used to probe how Evo 2 encodes species relatedness, using evolutionary distance as an external ruler for the model's internal geometry. In doing so, we characterize what is, to our knowledge, one of the most complex natural manifolds studied in a foundation model—richer than the cyclic or helical structures examined in language models.
Although preliminary, our results add evidence to two emerging observations about feature manifolds:
- Geodesic distances—shortest paths along the manifold—can track true distances; here, geodesics correlate with evolutionary branch length.
- Manifolds appear to be organized around a flat representation (an approximately low-dimensional “phylogeny space”) that is overlaid with additional curvature or “ripples.” The departures from flatness may capture semantic content, such as biological features for individual clusters, or may serve to better distinguish nearby representations for the model's internal mechanisms.
Manifolds seem to be important types of representations - and ones that are not well-captured by current methods like sparse autoencoders (SAEs). Here we used a supervised approach, but developing unsupervised techniques for manifold learning (an area we're already working on!) is important. This work required substantial manual effort, but we'd like techniques that can achieve similar results in an automated and scalable way, e.g. using agents.
While these are intermediate results, they start to suggest a playbook for extracting a scientific model's “natural ontologies” for study. We're excited about developing this direction further, for example by doing a similar analysis at the gene level to understand how the embeddings reflect molecular functions and pathways, using Gene Ontology annotations [30]Gene ontology: tool for the unification of biology
Ashburner et al. Nat Genet. 2000 May;25(1):25-9. [DOI]. Better understanding of these representations can be a starting place for circuit-level analysis to understand how these representations are built-up and used, which would in turn lay the foundation for auditing and debugging outputs and editing the model itself.